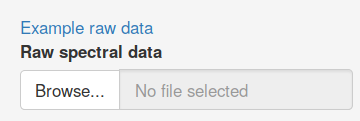
Step1: Uploading spectral data files
The first step for CliqueMS Web is that you upload your spectral data in two formats, raw and processed by XCMS. This is because CliqueMS Web requires the profile data, which for memory optimisation is not included in processed XCMS objects, that only have the peak picking and related information. The accepted formats for raw data are 'mzXML', 'mzData', 'mzML' and 'netCDF'. For the processed data they have to be R objects from XCMS package of class 'xcmsSet' or 'XCMSnExp'. You can use the spectral example data for practise:
Once the spectral data is uploaded the Annotation button will be activated. Now it is time to set the annotation parameters.
Step 2: Set annotation parameters
Clique parameters
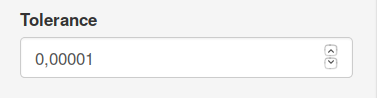
CliqueMS Web uses a network-based algorithm to group features that are likely to belong to the same metabolite. These groups correspond to cliques (fully connected components) in a network created from the spectral data. As there are many clique configurations, CliqueMS uses a probabilistic model, and finds the clique groups that maximise the log-likelihood of that model. CliqueMS Web will try several clique groups until the log-likelihood cannot be increased or until this increment is very small.
The tol parameter sets the minimum relative increase in log-likelihood.
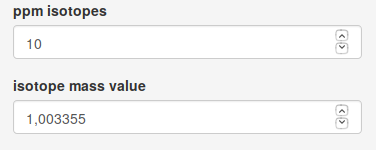
Isotope parameters
An important number of features inside groups correspond to metabolite isotopes. CliqueMS Web annotates carbon isotopes. Two features are considered isotopes if the difference in m/z and intensity fits the mass difference specified by isotope mass value parameter within the range of a relative error specified by ppm isotopes .
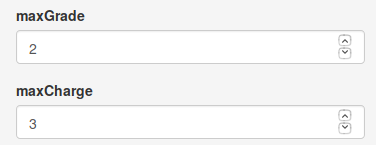
The maxGrade par controls the maximum number of isotopes allowed for a feature, and the maxCharge parameter controls the different charge values (from 1 to maxCharge ) when two m/z values are compared.
Annotation parameters
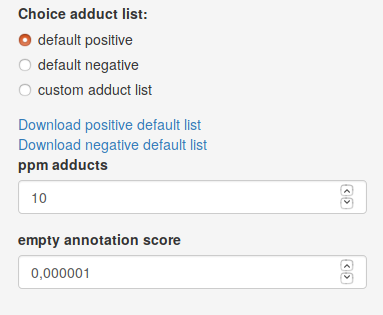
To set the annotation parameters, first choose polarity according to the ionization of your spectral data. The annotation of adducts by CliqueMS Web finds groups of two or more features whose m/z value is compatible with a molecular mass and two or more adducts from the adduct list within the range of a relative error controlled by ppm adducts parameter. As the number of putative adducts and molecular masses grows very rapidly with the clique group size, CliqueMS Web only reports the five top annotation for each clique. The top scoring annotations are obtained in the following way:
- Report one molecular mass per clique or the minimum number of molecular masses.
- Report the molecular masses that contain the most frequent adducts in the adduct list (defined as the logarithmic frequency).
- Report the molecular masses that annotate the largest number of features. As empty annotations are penalised, if you use a
custom adduct list , change the empty annotation score parameter to a lower value than the frequency of the least frequent adduct of your custom adduct list.
Once data files are uploaded and parameters are set, you can press Annotate data to obtain annotation results. If you follow the tutorial with the example data, the results showed here are obtained with default parameters.
Clique results
The first result after the annotation will be a table showing the number of clique groups in your spectral data.

The next result is a histogram that shows the distribution of the number of features per clique group. You can change the number of bins to see a more general count or a more detailed picture.
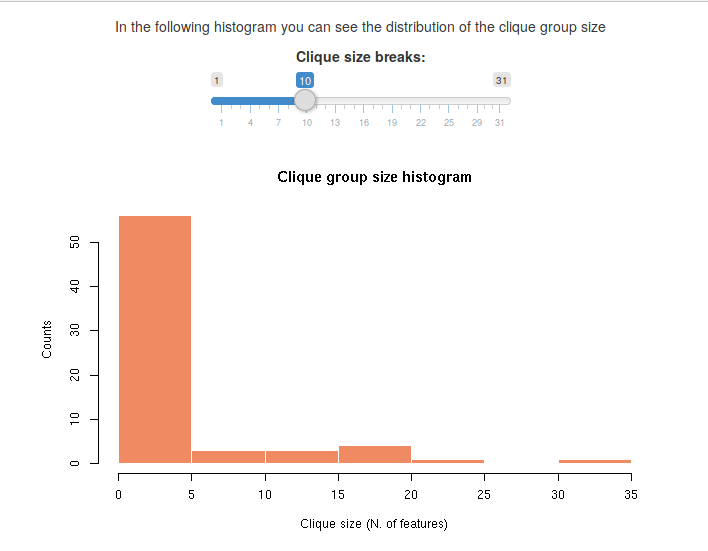
Usually, there is a larger number of cliques with one or few features, and the number of cliques with the largest number of features is very small.
Isotope annotation results
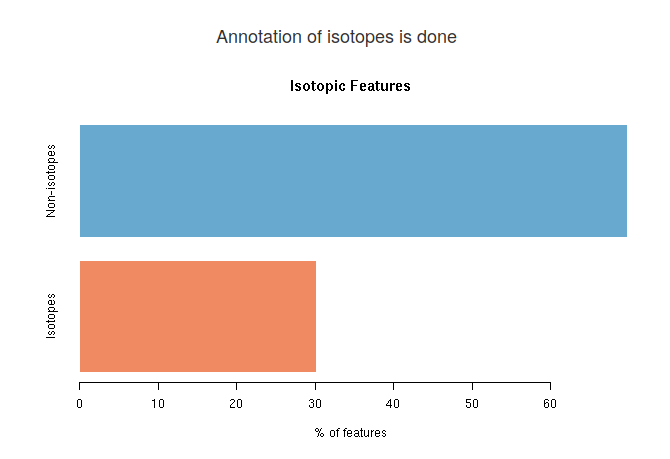
When isotope annotation is done, you will see a barplot showing the distribution of isotopic features in your spectral data. In blue is the percentage of features that are monoisotopic masses (they do not have any isotope). In red, you will see the percentage of features that at least have another feature that is an isotope.
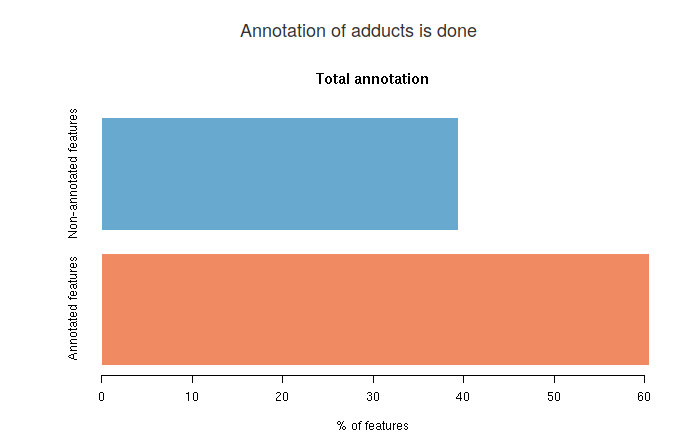
Adduct annotation results
You will see three different results for adduct annotation. The first barplot shows an overall annotation result. In the blue bar you see the average percentage (among top five annotations) of features that are not annotated. In the red bar is the average percentage of features that are annotated.
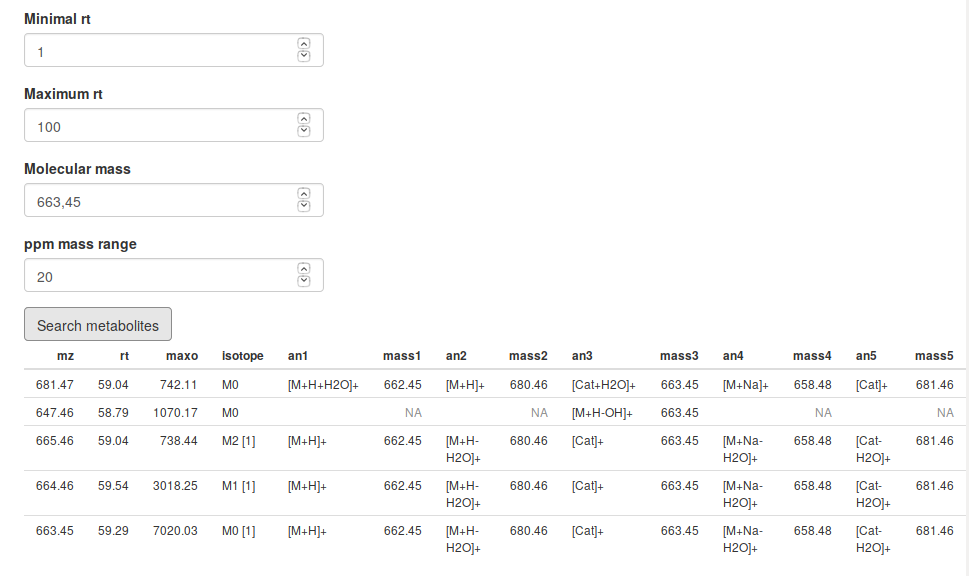
The next result is an interactive data table to search for annotated metabolites. First you have to set a retention time range, with the Minimal rt parameter and with the Maximum rt parameter. Within this time window, you will see all features that have a molecular mass as your Molecular mass parameter within an error defined by ppm mass range parameter. In the picture you see all features that between 1 and 100 seconds have a molecular mass of 663,45 Da within 20 ppm.
Finally, with the Download Annotation button you can download a csv table with the complete annotation for all features in your data. This table also contains the normalized score, useful to compare the confidence of each annotation. The normalized score goes from 0, which represents the empty annotation (all features of the group without annotation) until 100, which is the theoretical maximum annotation (all the features of the group annotated, with the most frequent adducts and with the minimum number of neutral masses).